
Surface Weather Map Exercise
Exercise Goal
Weather is the state of the atmosphere at a particular time and place. It is defined by many weather elements such as air temperature, humidity, precipitation, cloudiness, visibility, barometric pressure, and wind speed and direction. The ability to read and interpret the information found on the surface weather map is essential for the meteorologist and his/her forecast of near term weather conditions.
After completing this activity, you should be able to:
- Decode the symbols appearing on a surface weather map and describe weather conditions at various locations on the map.
- Identify fronts appearing on the map, the weather likely to be occurring on either side of a front, and the motions of fronts.
- Describe general relationships between wind patterns and centers of high and low air pressure shown on weather maps.
- Hypothesize what weather conditions may be like in the next day or two at specific locations.
Background Information
Before you begin this exercise, you should review the following link on Z-Time on Weather Maps and the handout given in class on the first night (How to Read Weather Maps - Handout on Plotting Station Models). This is a link to my web page where you can find the document again if you have misplaced yours. You will also need the following images which may be downloaded and printed.
|
(print landscape) |
(print landscape) |
(print and fill in before answering questions in this exercise, if you wish) |
Investigations
Before you begin this section, download and print the answer sheet so that you can answer the questions before completing this online exercise (if you wish). The questions for grading are embedded within the following numbered items and once answered, your submissions will be immediately graded. When the exercise is complete, the score will appear in the Blackboard gradebook. You will not need to turn in the completed answer sheet.
1) Examine the surface weather map presented in Image 1. The weather symbols shown are those commonly seen on television, in the newspaper, and on the internet. The H's and L's identify centers of relatively high and low air pressure compared to their surroundings. These pressure systems are commonly 500-1000 miles across. The "H" positioned in Texas locates the center of a high pressure system; atmospheric pressure increases horizontally inward toward this "H" and decreases horizontally outward away from the "H".
Value: 1
2) The thick curved lines on the map are air mass boundaries. In the atmosphere, broad expanses of air with generally uniform temperature, humidity, and density come in contact with other masses of air having different temperature, humidity, and density. Because air masses of different densities do not readily mix, the boundaries separating air masses tend to remain distinct. These boundaries, which are actually narrow zones of transition, called fronts, typically separate warm and cold air. Think about the various frontal boundary types we discussed in class and the air masses they separate (warm, cold, cool) as you answer the questions below.
![]() Answer question #2 below by matching location letters with the air mass temperature
Answer question #2 below by matching location letters with the air mass temperature
Value: 1
![]() Answer question #3 by matching location letters to the prevailing wind direction at the site.
Answer question #3 by matching location letters to the prevailing wind direction at the site.
Value: 1
Value: 1
![]() Answer question #5 (no map needed for this one)...
Answer question #5 (no map needed for this one)...
Value: 1
6) Make certain you have the "How to Read Weather Maps" - Handout on Plotting Station Models handout from the first night of class to help you answer the following questions. Interpret the following station model plotted data:
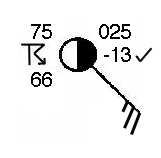
Remember that wind direction is shown by the "arrow" shaft drawn into the circle representing the station. Unless otherwise noted, north is to the top on the page (map) and east is to the right. Wind is always named for the direction from which it blows.
Wind speed is rounded off to the nearest 5 knots and is symbolized by "feathers" drawn on the clockwise side of the wind-direction shaft. A full feather represents 10 knots (11.5 mph) and half feathers indicate 5 knots. A pennant indicates 50 knots and a circle drawn around the station circle signifies calm conditions.
Value: 1
Air pressure (adjusted to sea-level) is reported as a coded number to the nearest tenth of a millibar (mb). To decipher the plotted pressure value, first place a decimal point between the second and third number from the left. Then add a "9" or "10" to the left so that the resulting number falls within the range of air pressures that commonly occur at sea level (usually between 960 mb and 1050 mb). For example, a plotted value of 126 represents 1012.6 mb and 863 denotes 986.3 mb. Pressure change in the past three hours is reported in 10ths of millibars.
Value: 1
Sky coverage (total amount of cloud cover) is reported inside the station circle. An empty circle indicates no cloud, a half-shaded circle means four-eights of the sky is cloud-covered, and fully shaded circle stands for a completely overcast sky.
Current weather is plotted at the "9 o'clock" position on the station model (to the left of the station circle) using a variety of symbols representing the particular weather conditions. The reported current weather is a thunderstorm.
Questions 8-11 refer to the 00Z 03 MAR 2009 weather map (Image 2).
8) Click onto Image 2 which is the 00Z 03 MAR 2009 surface weather map. It shows the weather conditions across the country as a cooler continental polar air mass moved in and extended across the entire eastern two-thirds of the U.S. Arizona is in the mountain time zone of the U.S. and is seven time zones west of the Prime Meridian.
Value: 1
9) Examine the weather stations at: St. Louis, Missouri; Minneapolis, Minnesota; Indianapolis, Indiana; and Nashville, Tennessee. Paying particular attention to the wind speed and direction, are the observed values consistent with their location relative to the main pressure feature in the area ('H' pressure)? Yes, they are...so in the following question, you are to select ALL answers that would explain WHY this is the case.
Value: 1
10) Along the border with Canada, International Falls, MN, had a sea level pressure of 1032.8 mb and at San Antonio, in south-central Texas, it was 1020.7 mb. The dewpoint is the temperature to which air must be cooled (at constant pressure) to achieve saturation (100% relative humidity). The higher the dewpoint, the greater the concentration of water vapor in the air.
Value: 1
11) The western boundary of continental polar air moving out of Canada is shown by a heavy line (blue and red if in color) with alternating triangles and half circles stretching from northern Montana to Oklahoma. This line locates the position of a stationary front. Further west, running from the U.S./Canadian border and south to eastern California lies a cold front coming in from the Pacific. In the next question, order the air masses by overall temperature from warmest to coldest (1 = warmest to 3 = coldest)
![]() Ordering question on air mass temperatures...
Ordering question on air mass temperatures...
Value: 1
Questions 12-14 refer to the 12Z 10 MAR 2009 surface weather map (Image 3).
12) Centered in west-central Missouri is a low pressure center (also called a mid-latitude cyclone) on the 12Z 10 MAR 2009 surface weather map (Image 3).
Value: 1
Value: 1
14) Extending toward the east from the "L" marking the center of the low pressure system over Missouri is a warm front. What would be the forecast for a location north of this frontal boundary such as Indianapolis, IN or Peoria, IL? Read the next question to answer this...
Value: 1
15) Warm air can "hold" more water vapor than cold air. The relative humidity is a ratio that compares the water vapor content of the air with the air's water vapor capacity and is given as a percentage. A parcel of air with a relative humidity of 60% means that the parcel is "holding" 60% of the water vapor it could contain at that given temperature. If the temperature and dew point are close together, the relative humidity is high. If the temperature and dew point are far apart, the relative humidity is low; that is because the temperature of the air parcel must be cooled quite a bit to cause it reach saturation (100% relative humidity). Examine the following two locations: Milwaukee, WI and Dallas, TX. Using the information from these two stations, answer question #15.
Value: 1
Late completions will NOT be accepted.
The exercise is based on material from the American Meteorological Society's DataStreme Project. 12 August 2009
