|
To do: Print out pdf document for Lab F Exercise - Introduction to Geographic Tools - Contour Lines and Profiles
Materials needed: Buffalo Head enlarged topographic map section, Folsom, NM and Glendale, AZ topographic maps (all on reserve at the GCC Library), and a pencil.
Part I. Characteristics of Contour Lines
To do: Complete all parts.
Read page F-1 carefully as the text describes the rules of contour lines and what the patterns can tell you about the terrain.
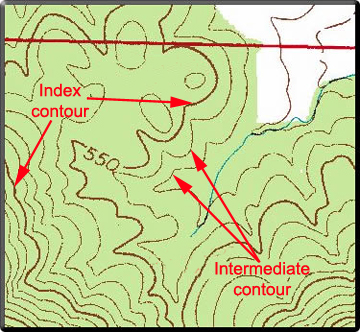
There are three types of contour lines that you will encounter on a topographic map.
- Contour lines (intermediate contours) - thin brown lines on the map
- Index contours - thick brown lines on the map with elevation values on them
- Hachure contours - thick or thin brown lines with tick marks pointing towards the inside. Hachured contours indicate "closed depressions".
 |

|
Looking over the six examples on page F-2, let's start by comparing the top two images. Upper left has closely spaced contour and the upper right has widely spaced contours. Spacing tells us about the slope. Given that the two images are from a map of the same scale, we can state that where the contours are closer together, the slope is steeper. Closer spacing of contours tells us that elevation is changing faster over distance, in other words, a steeper gradient.
The pictures below present a nice example of contour spacing in relation to slope. For example, notice the spacing of the contour lines on the flat plateau at the top. Wide spacing of contours indicates flat terrain. Once you leave the flat plateau and start moving down the steep slope, notice on the left image how close together the contours are... close contours indicate steep slopes. Also notice how the contour make the "V" notches pointing uphill where there are valleys. We'll see this again later.
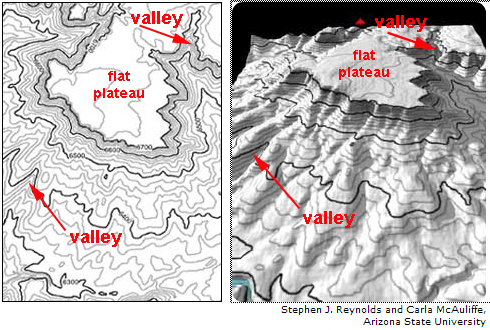
Figure F-3 shows a hill top or peak. We see concentric contours with no hachure marks. Highest elevation is somewhere inside the smallest contour at the center where the arrow is pointing.
Figure F-5 shows a closed depression or hole as indicated by the hachure contours. Towards the outside of the picture there are no hachures indicating that the terrain is rising there, then when we start seeing hachures, we know that we are now descending into a hole of some kind. This map section shows the sunken caldera of a volcano.
Figure F-4 shows a valley and this one has an intermittent stream flowing through it. A valley is identified by the "V" shaped notch to the contours. An important rule to remember is that the notch always points UPHILL. If you remember that, you will always be able to determine which way a river is flowing through the valley. Another example is shown below.

Figure F-6 shows a saddle. A saddle is a low pass between higher peaks. The arrow is pointing to the saddle location. Another example is shown below. This diagram (below) also shows the difference between a topographic view (view from the top) and a profile view (side view). You will be constructing a contour profile later in the lab.
Part II. Interpreting a Contour Map
To do: Complete all parts.
The first part uses the enlarged section showing Buffalo Head. This enlargement was made from the Folsom, NM map which you also have before you. For questions 2-7, be careful as to what they are asking for - some questions ask for elevation and some ask for the feature type (e.g., hill, valley, etc).
Question 10. Describe the location of Buffalo Head using the U.S. Public Land Survey system. Buffalo Head crosses two sections, so put them both down.
Switch to the Glendale map to answer the rest of the questions on this page (F-3).
Part III. Constructing a Contour Profile
To do: Complete all parts.
Page F-4 shows the procedure for constructing a profile. You will have to do this again in lab N (week 14) so make sure you understand how to do this. The basic idea as shown in the illustrations in the exercise is to take a blank piece of paper and lie it down on the topo map along the transect you are to follow. In the exercise, you will construct the profile from letter "H" to "I" (page F-5).
Every time your paper crosses a contour line, make a mark on your paper and write down the elevation on your paper. When finished, take your paper and lay it at the bottom of the graph paper, as shown in the bottom figure on page F-4. From your marks, go up on the graph paper to the appropriate elevation and make a dot. Transfer all elevation points and connect with a line. Be sure to go straight up from your marks so that you maintain the slope of the terrain, in other words, don't jump to the nearest line on the graph paper. You need to transfer the data exactly so you can see where the slope is steep vs. gentle.
Study the example in the lab manual carefully and then do your own using the picture on F-5. The graph paper is on page F-7. The map on page F-6 is for you to use when you take your lab quiz this week.
WHEN YOUR LAB IS COMPLETE...Take quiz 13-F.
return to top | quit
Date Last Modified: December 27, 2006.
Copyright © 2006 Lynn Newman
|